Set the background (color/gradient)
Note
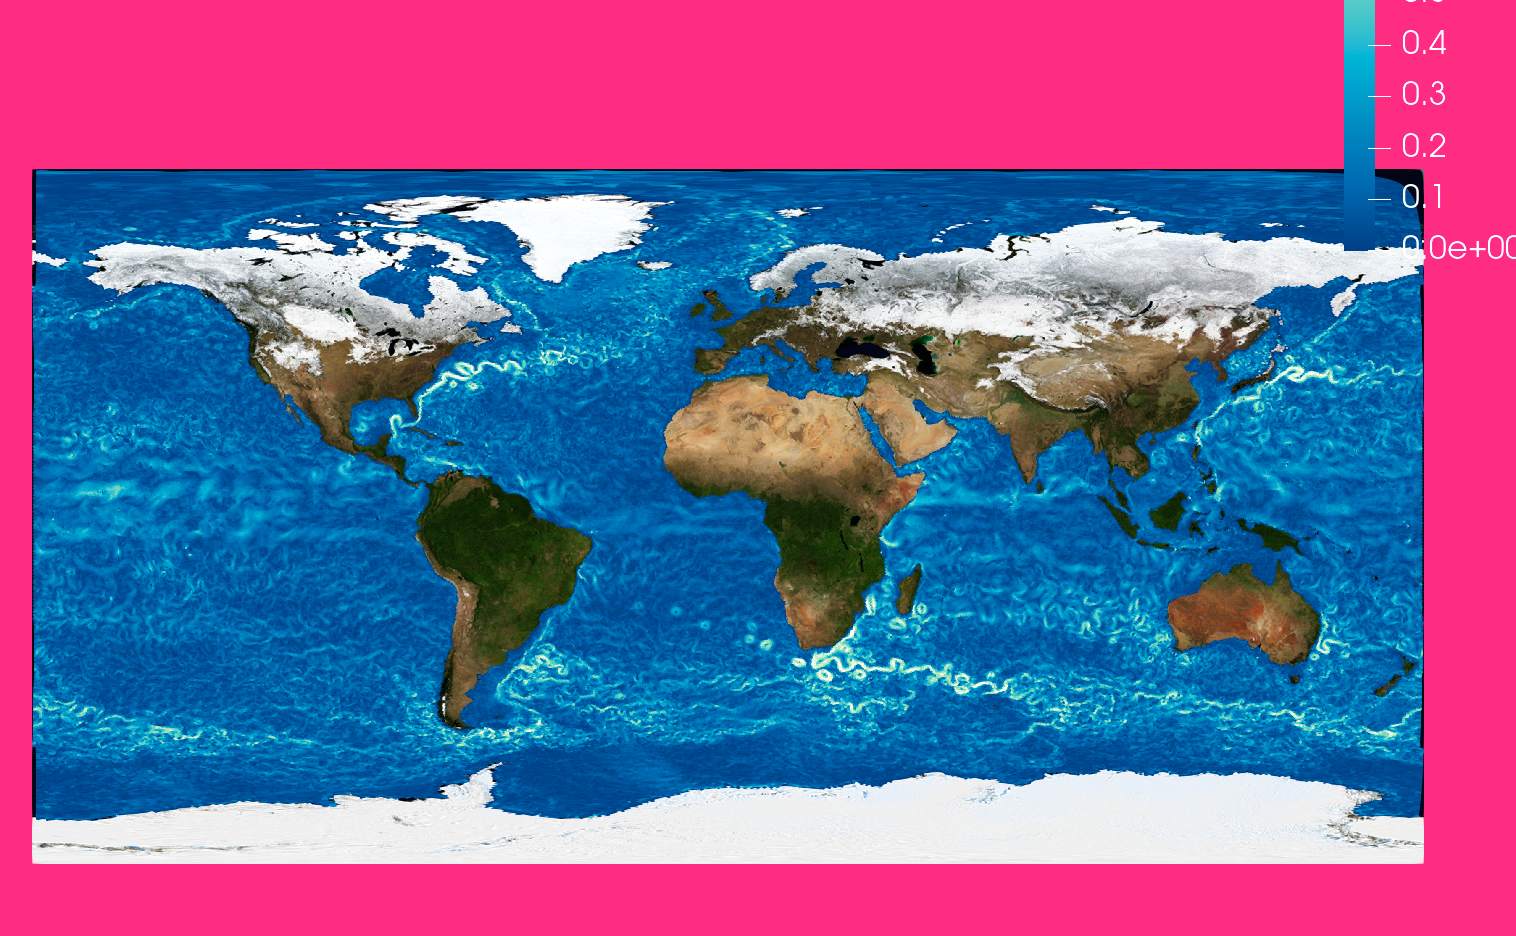
This document is part of a series teaching how to Create an image of sea surface speeds.
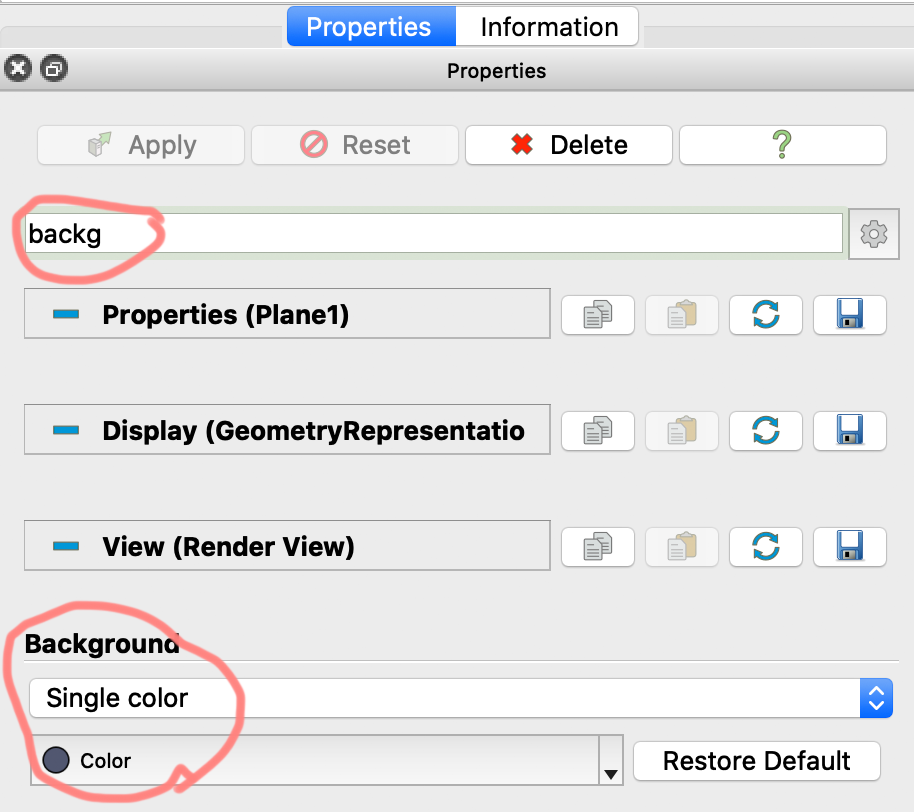
Set the background of the current plot
To set the background of your current project go to properties of any object, type backg into the text field, and chose a background of your liking. Chosing pink might help looking for holes in your data - or making your plot a bit special.
Next you could Adjust the color bar and its legend
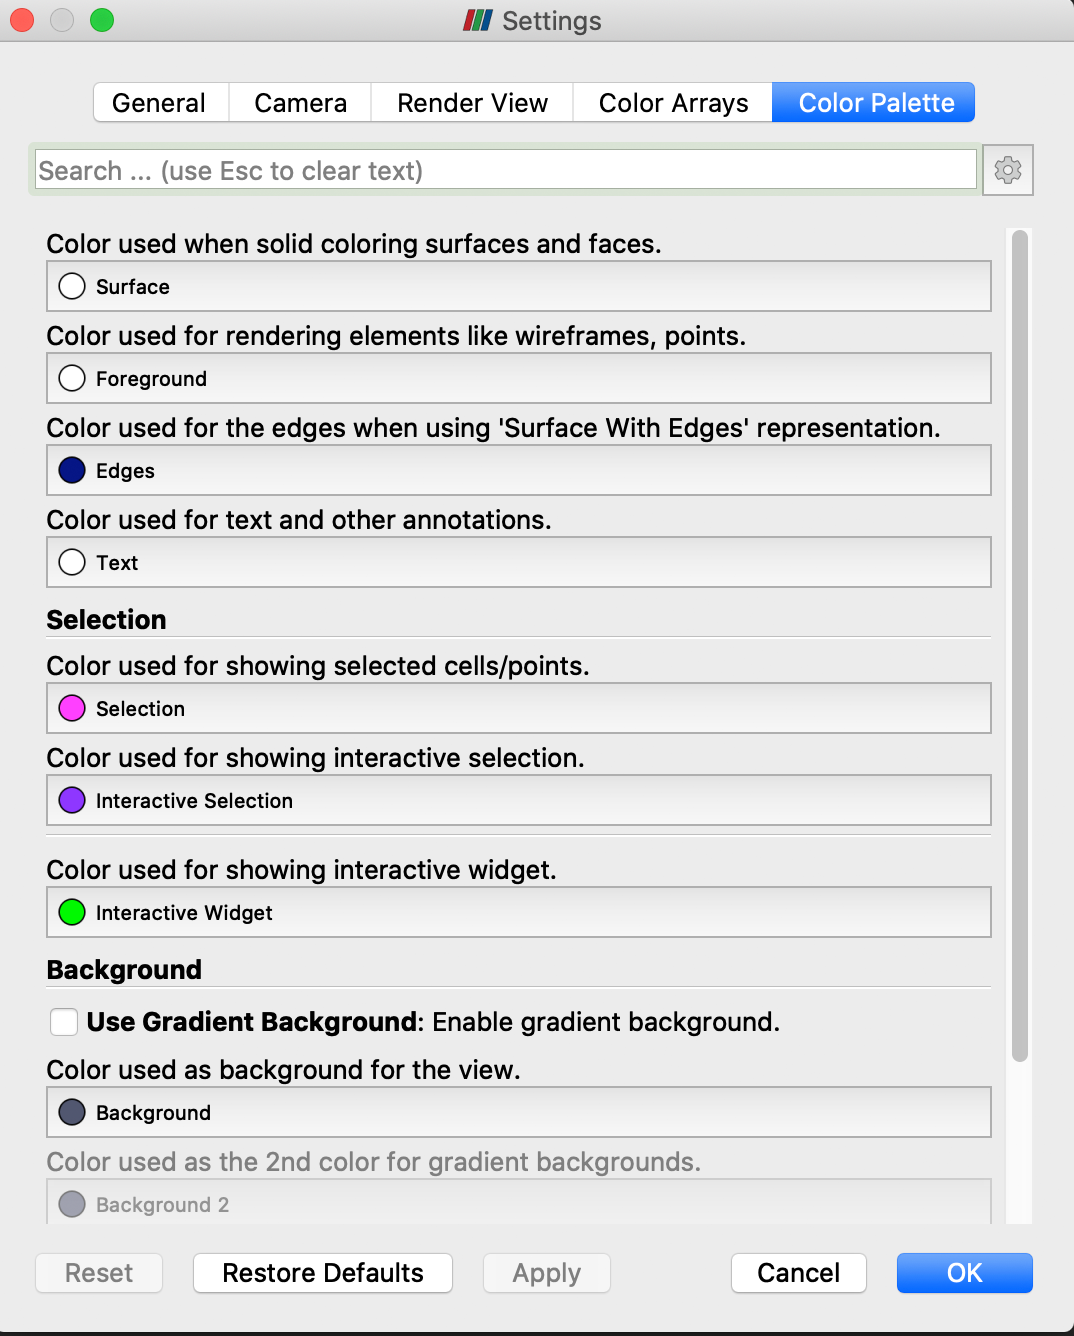
Set the default background
To set the default background Open the Paraview settings and adjust it in the Color Palette tab