Adjust the color bar and its legend
Note
This document is part of a series teaching how to Create an image of sea surface speeds.
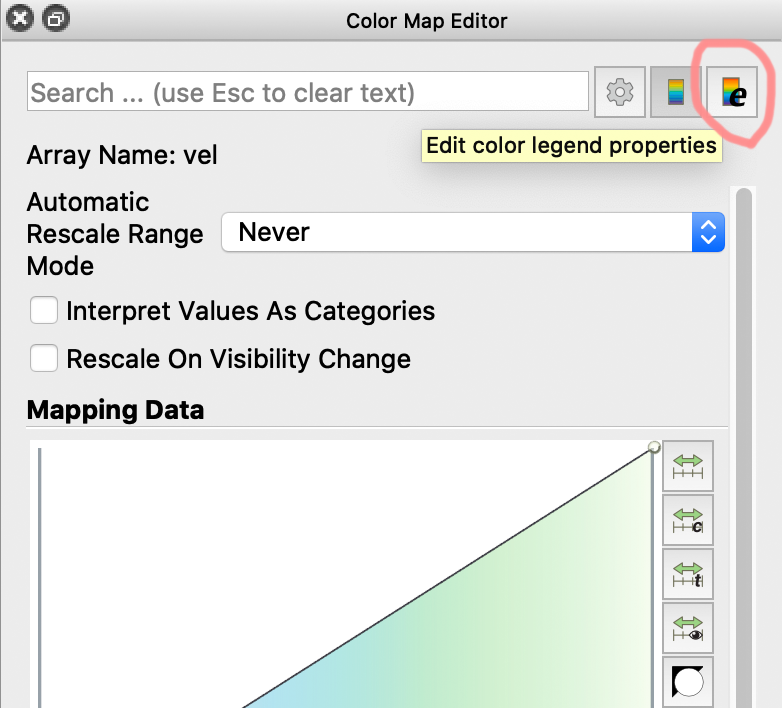
Chose the object you want to manipulate in the pipeline view on the left (e.g. Calculator1. Then open the colormap editor (View->Color Map Editor) and chose the top right icon (a color bar with an e in the icon).
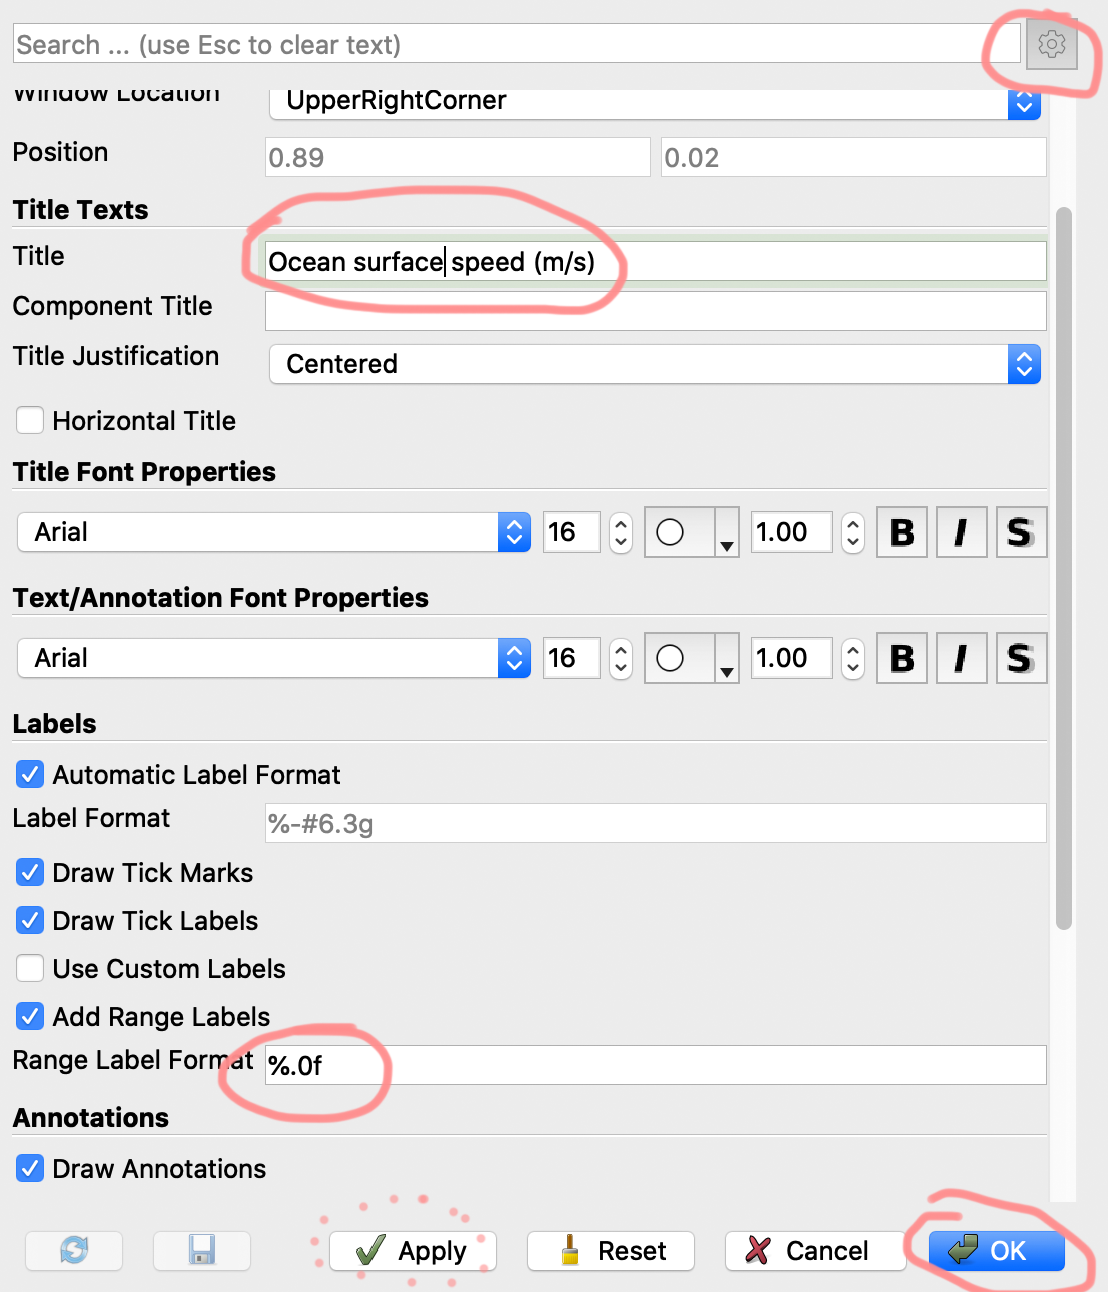
Choose the gear at the top right of the menu (activates the display of less important aspects like the top/bottom value labels), insert a more precise label text in the Title field, e.g. “Ocean surface speed (m/s)” and set the format for the range labels (top/bottom values) to %.0f (floating-point with zero digits behind the .). Use Apply to check your results and finally leave the menu with OK.
The result should look somewhat like
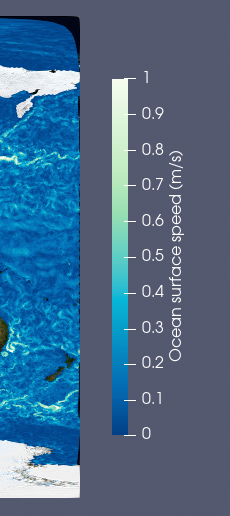
Next, you could de-activate the display of the coordinate system in the bottom right by clicking the icon with the eye and the coordinate axis in the right of the menu (see The Paraview main screen), and move on to Set the view size.