Load the ice sheets
Note
This document is part of a series teaching how to Create a multi-variable image / animation from a coupled ice sheet - climate simulation
Load the ice sheet data from pism_NH_777.nc
This file already is in point data (there are no bounds associated with the coordinates), so we don’t need a CellData2PointData filter.
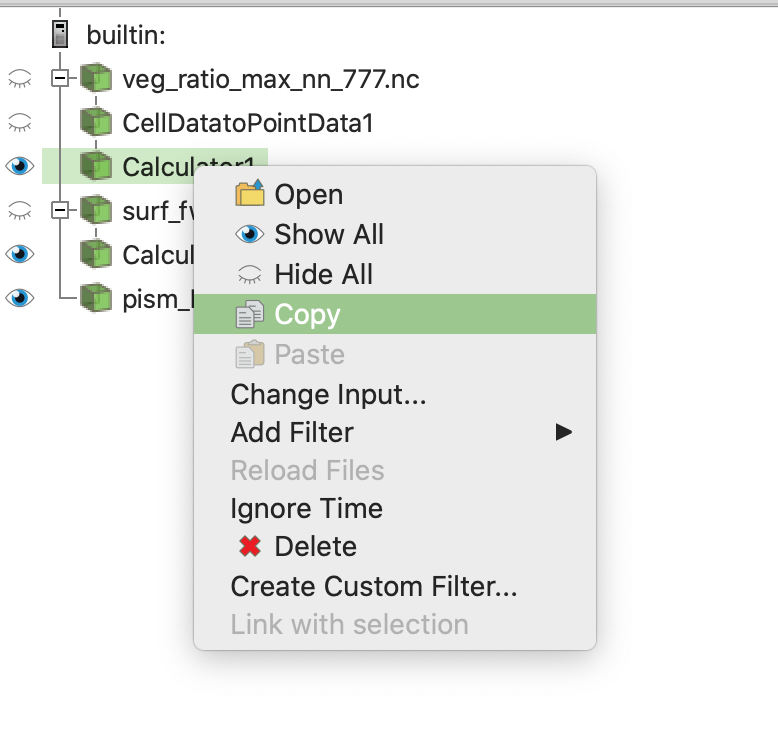
Attach a calculator
select the calculator of the vegetation in the pipeline view, copy it, and paste it to the newly created calculator (i.e. copy the settings to the calculator of the ice sheet).
Change
topgtoice_surfin the equation of the calculator.
Color by
velsurf_mag, choseUse log scale when mapping data to colors, load the colormap of your choice.Use the contour filter to display isolines to show the bedrock displacement, and re-activate the display of the ice sheet calculator in the pipeline browser.
Feel free to repeat the exercise for Antarctica. You might need to Convert cell data to point data before adding the calculator (for whatever reason). Now the isolines are added on the ice, but end at the coast.
(return to Create a multi-variable image / animation from a coupled ice sheet - climate simulation)