Load 2D ICON data with the CDI reader
Note
This document is part of a series teaching how to Create an image of sea surface speeds
You might need to Activate the CDI reader plugin
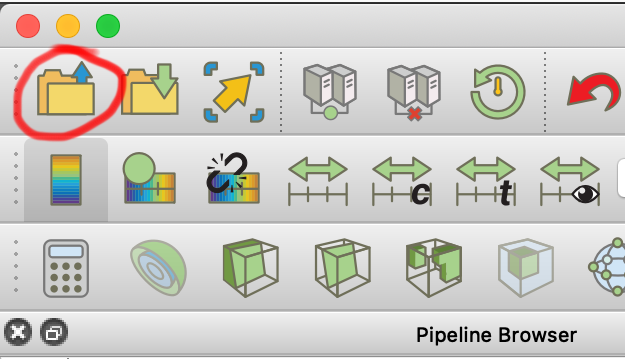
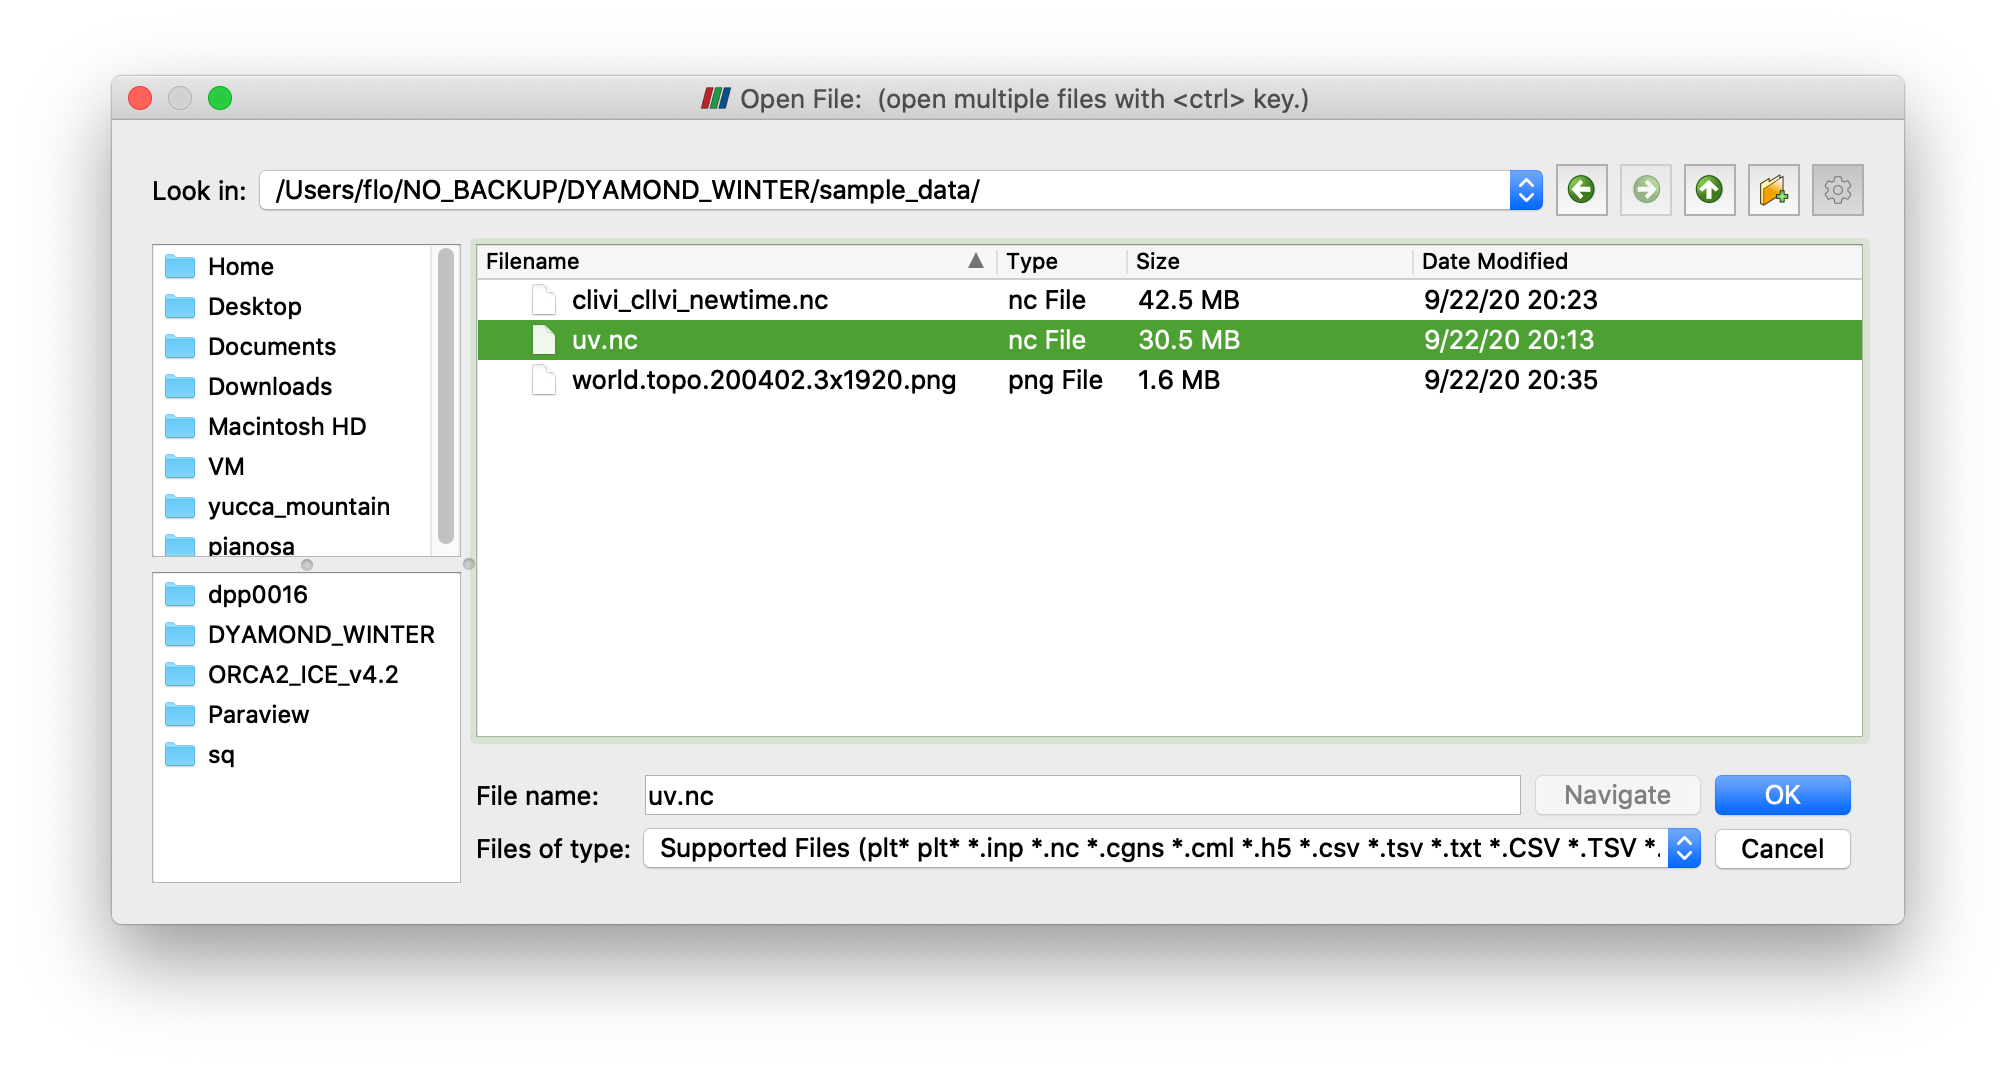
Use File-> Open.., or use the top-left icon to open the file choser.
Chose uv.nc (get it from ….)
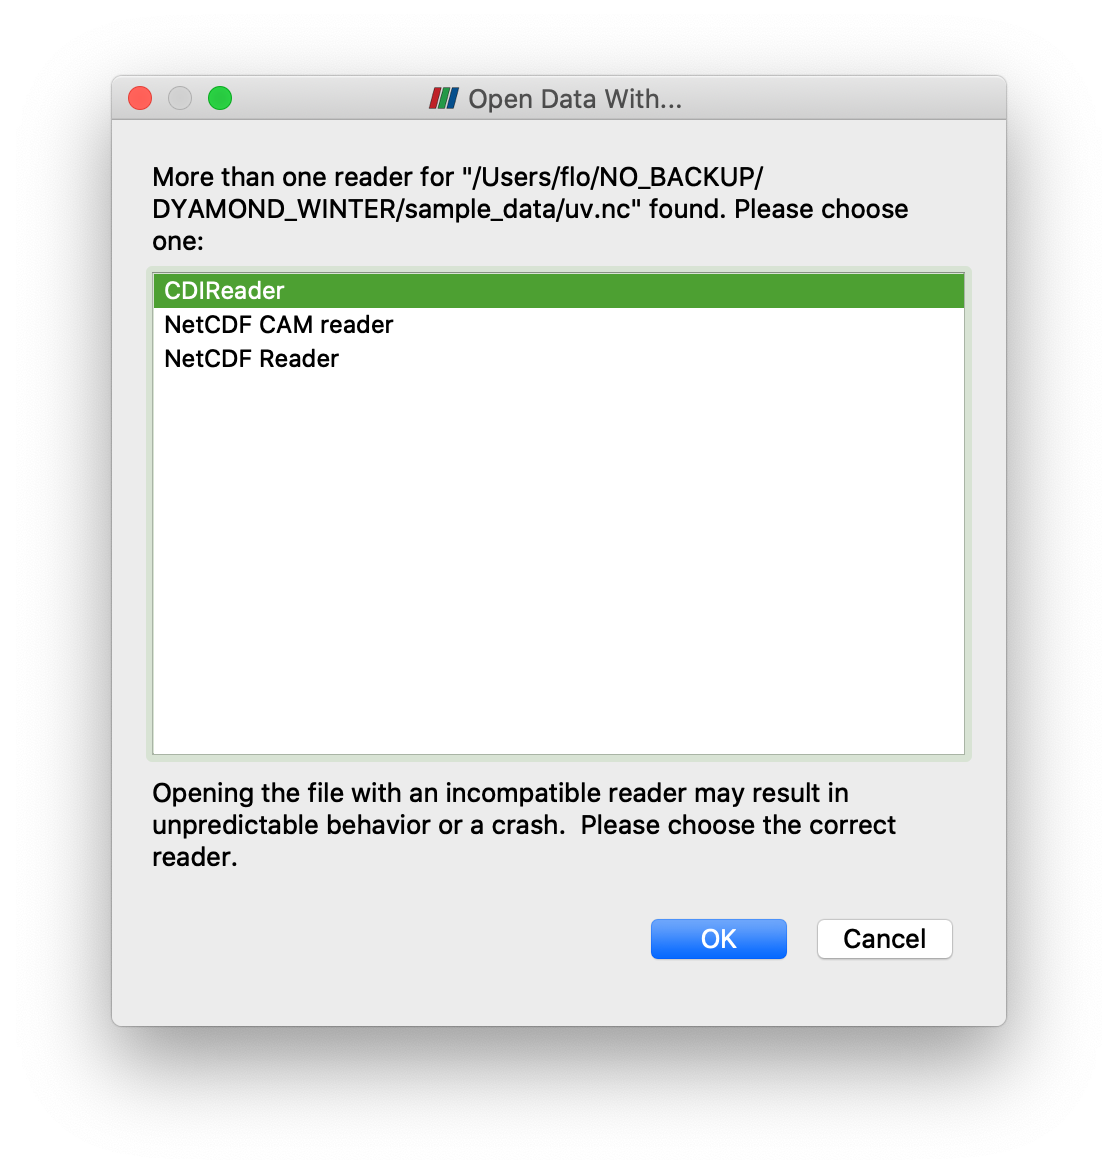
Chose the CDI reader for ICON files – Models with a regular (lat/lon, or stretched) grid usually go via “NetCDF Reader”. If CDIReader does not appear in the menu, you need to Activate the CDI reader plugin.
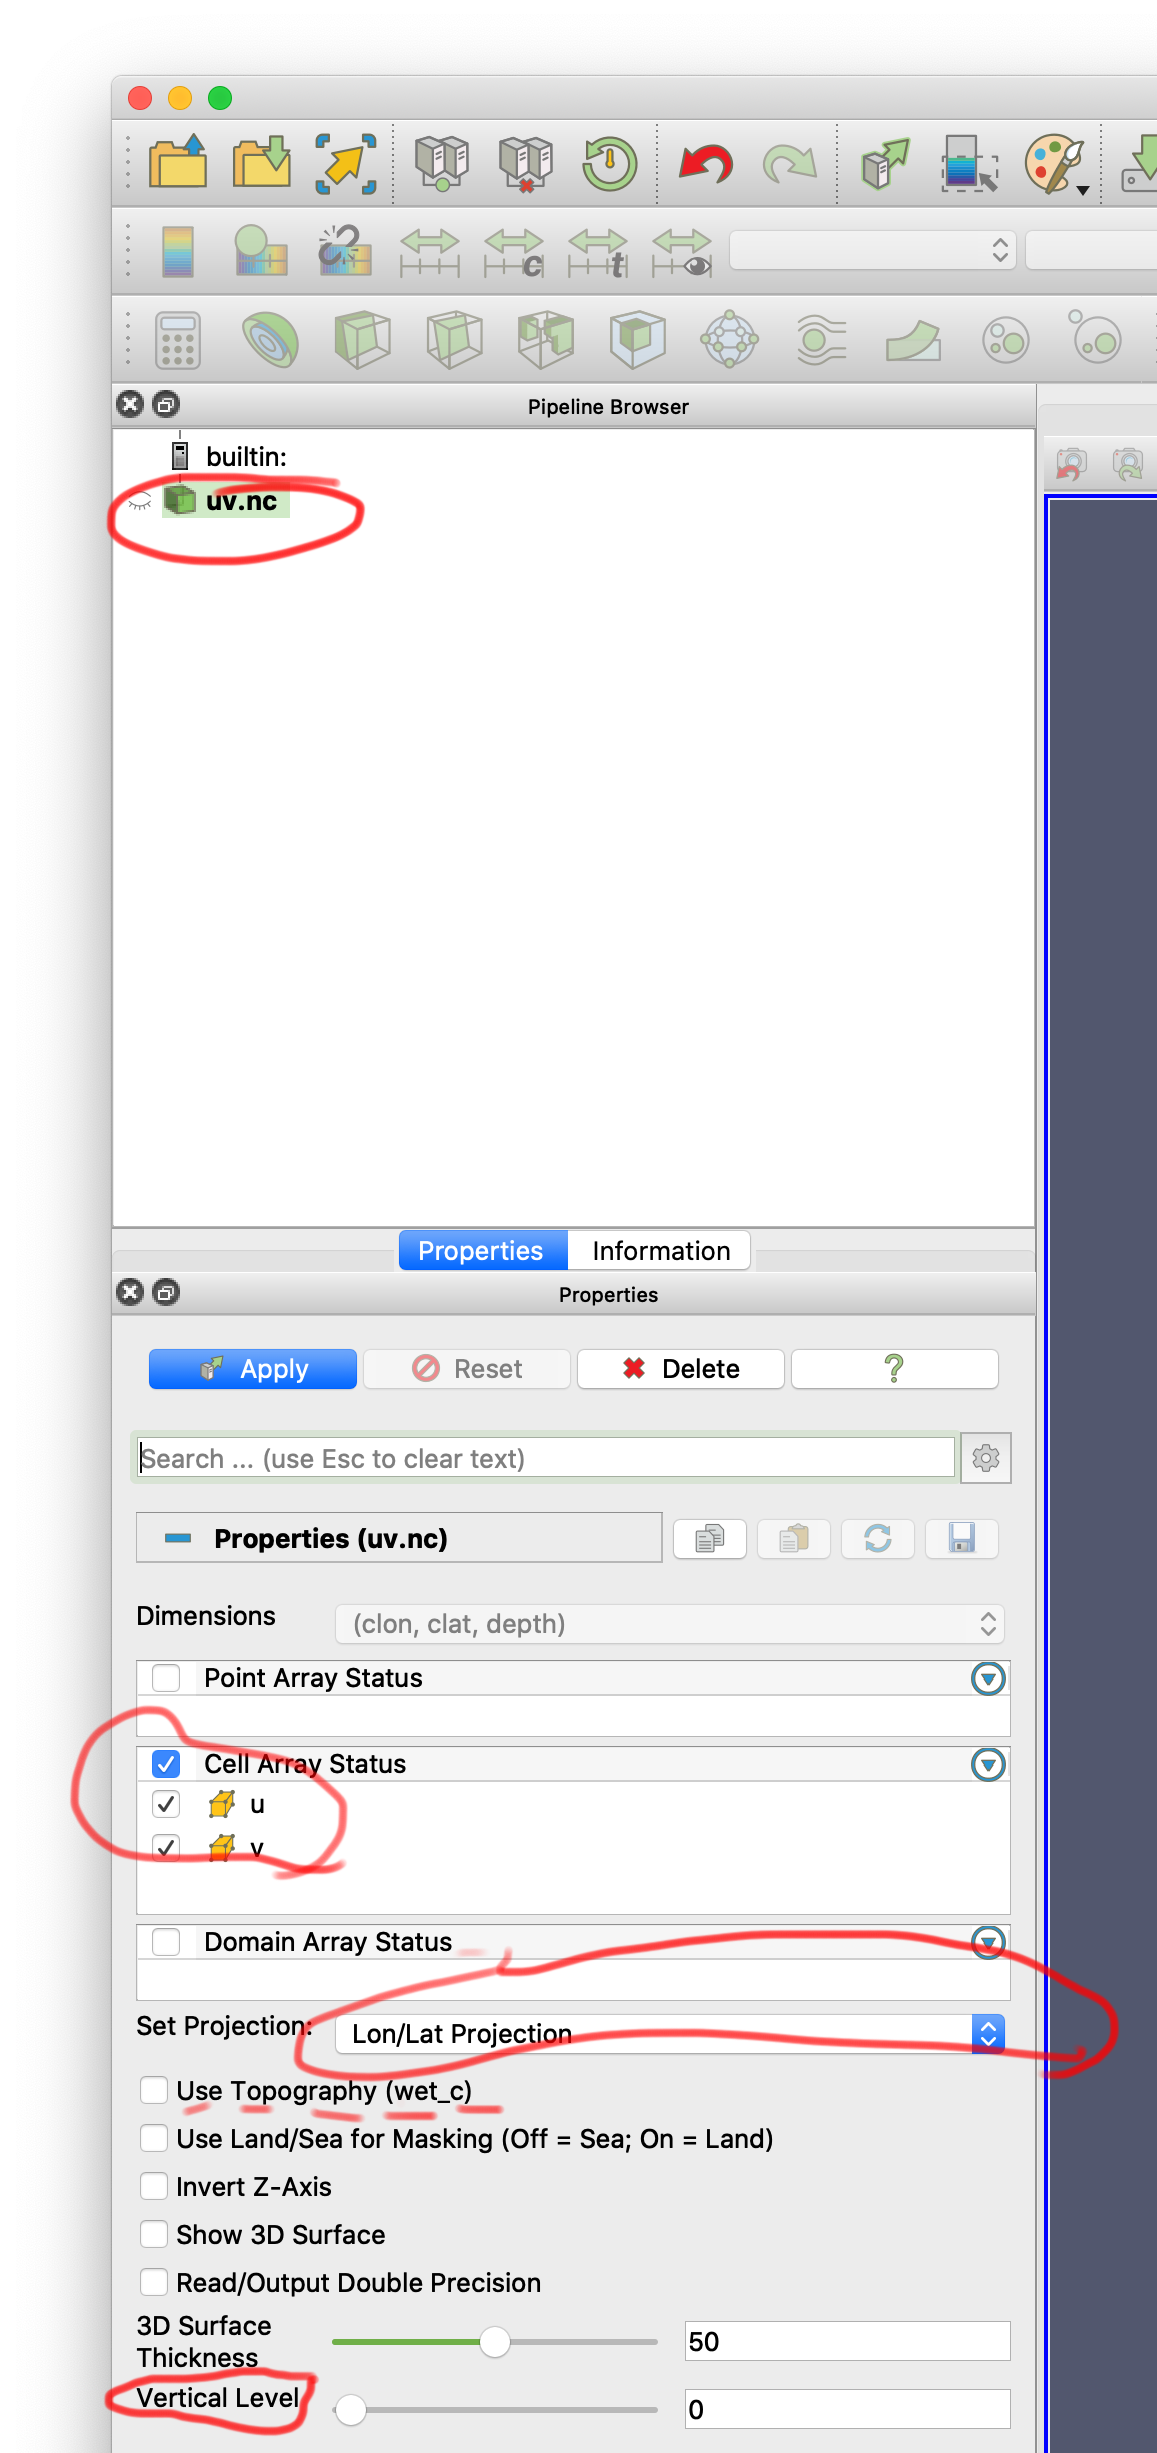
uv.nc now appears in the top of the pipeline (top left).
You can now chose which variables to load (we want u and v). They are considered as cell arrays, as we have all grid corners for them.
Below that, you can chose the projection. We’ll use Lat/Lon for now.
Some ICON Ocean data comes with zeros on land points. Then a wet_c variable can be used to get rid of land points.
With “Vertical levels” you can chose which vertical level you want to see if there’s more than one in the source file (not in uv.nc).
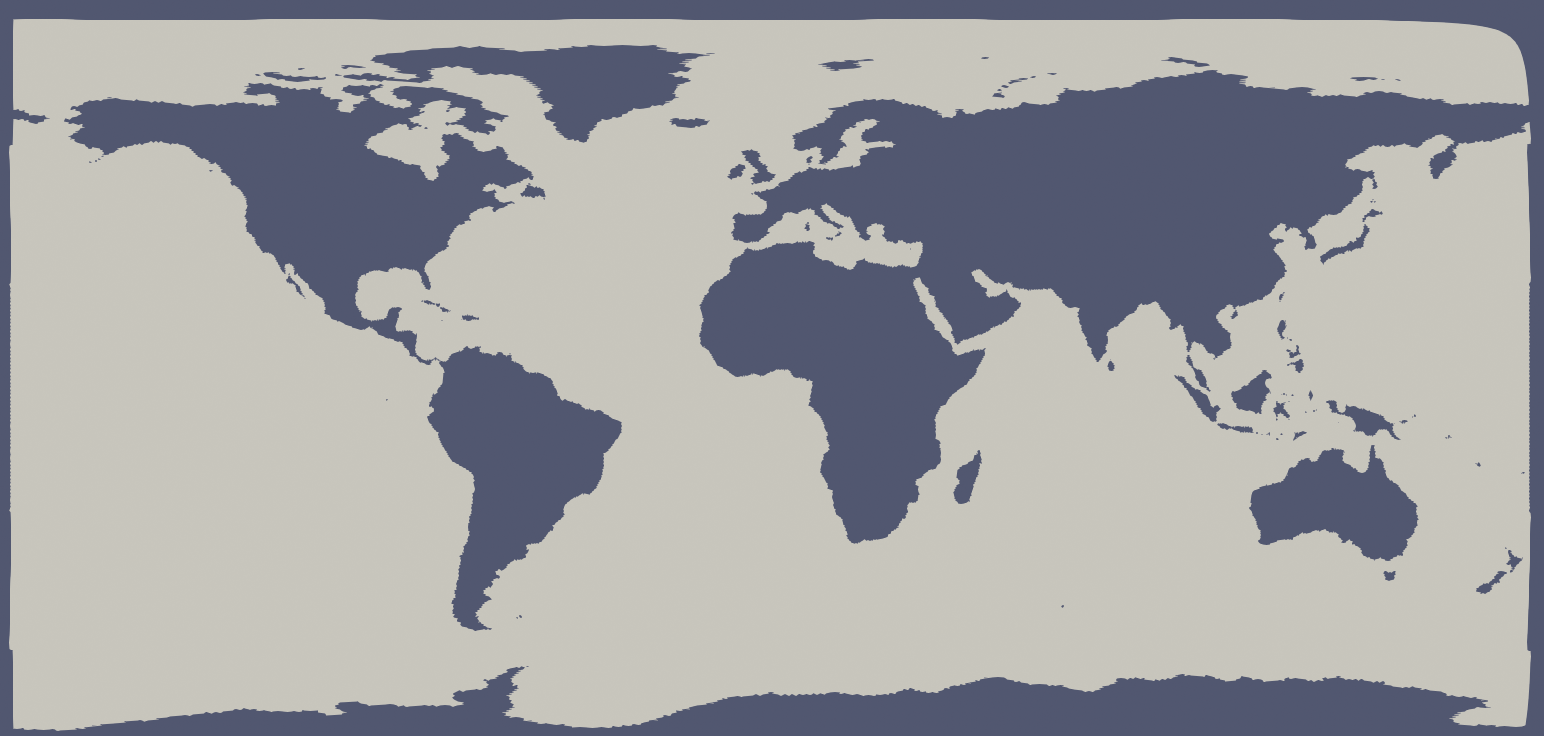
The result should look like this:
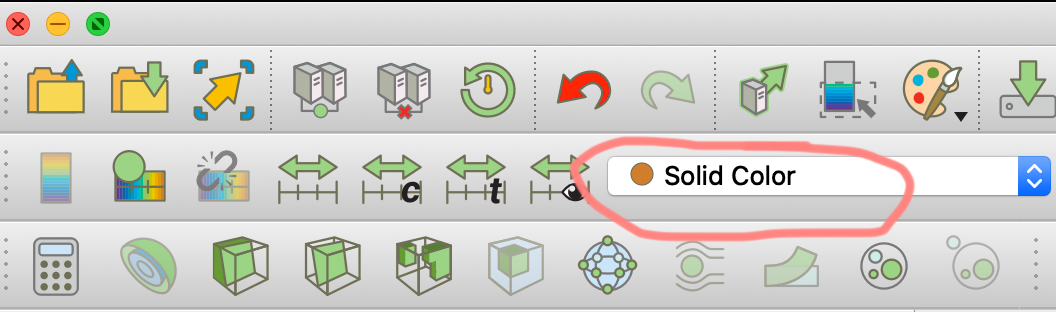
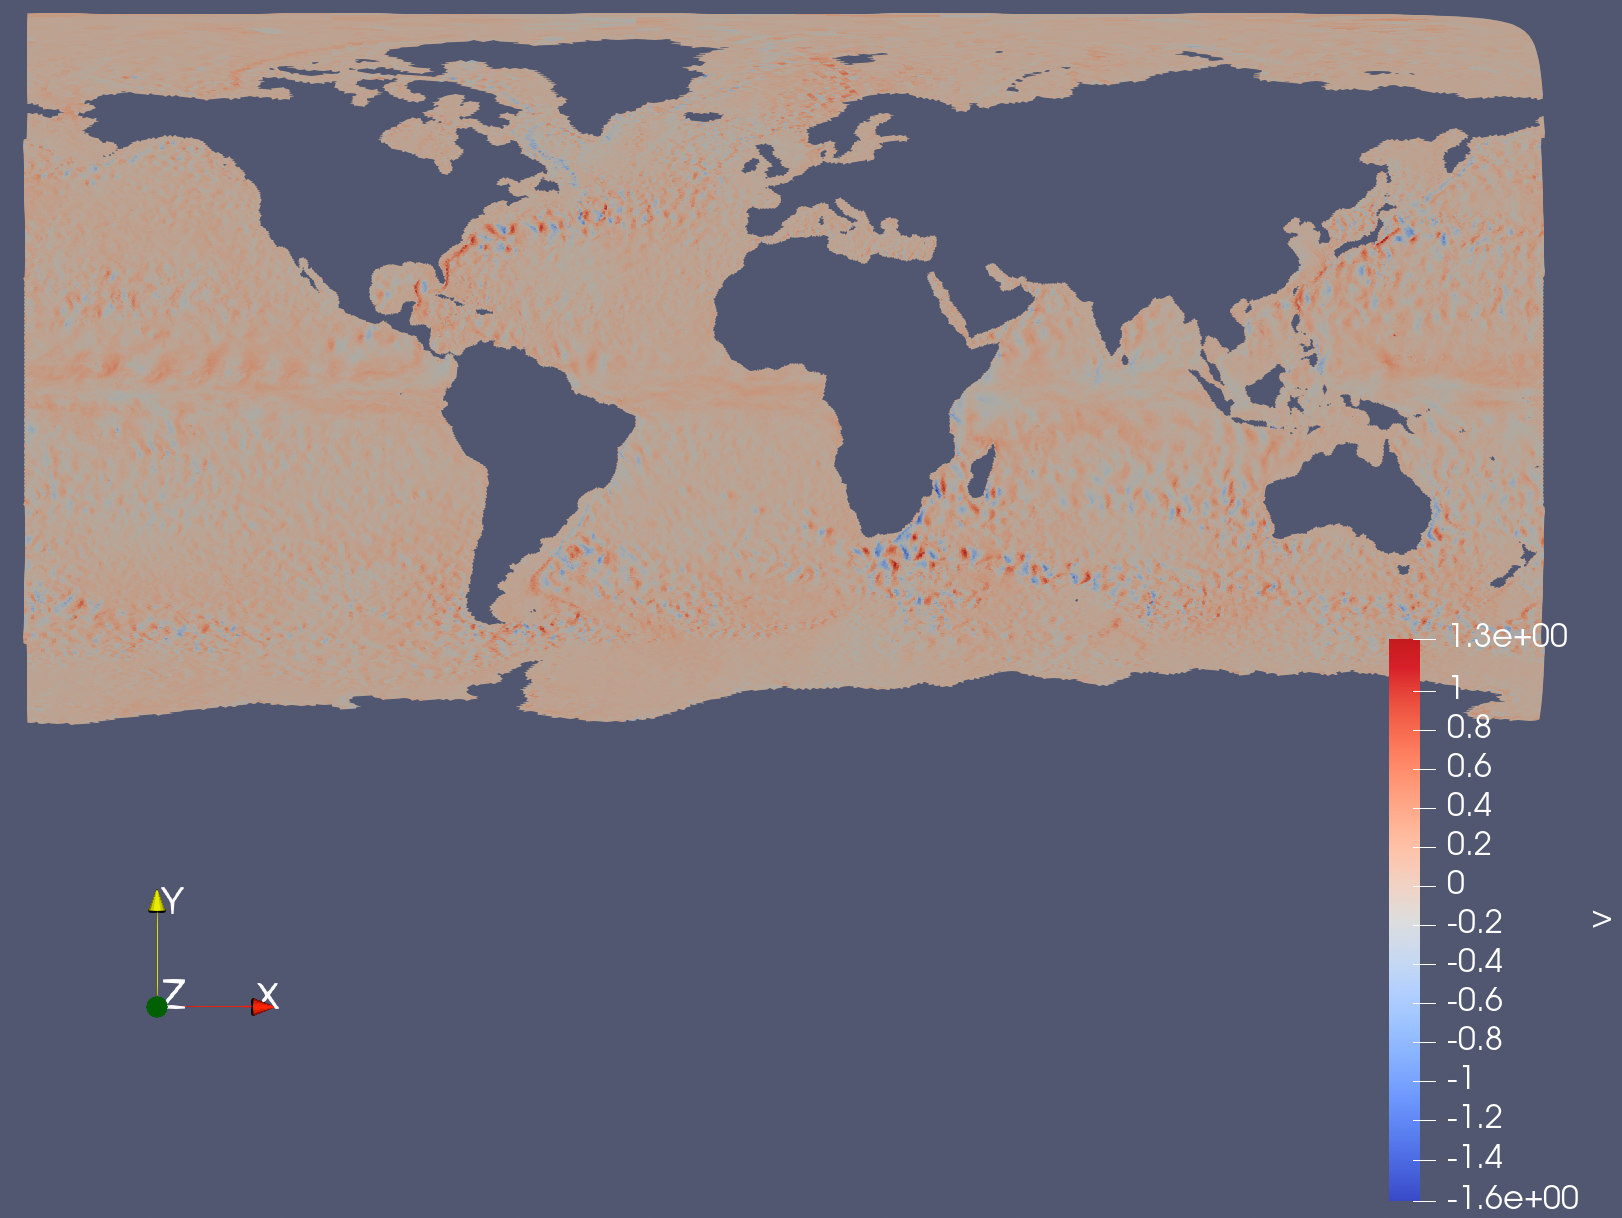
From the dropdown menu in the top you can chose to color by any variable, e.g. v
Which should give a basic idea of eddies and friends
You can now Apply a calculator to convert u and v into speed