Chose a different colormap
Note
This document is part of a series teaching how to Create an image of sea surface speeds
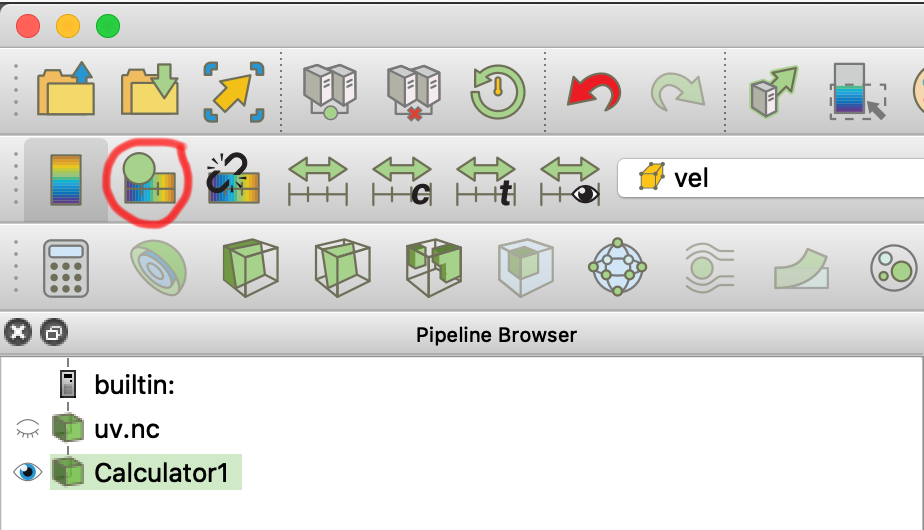
In the top left part of the paraview window, there is a color ar with a small green circle. This will open the color map editor (also available via View-> Color Map Editor Window)
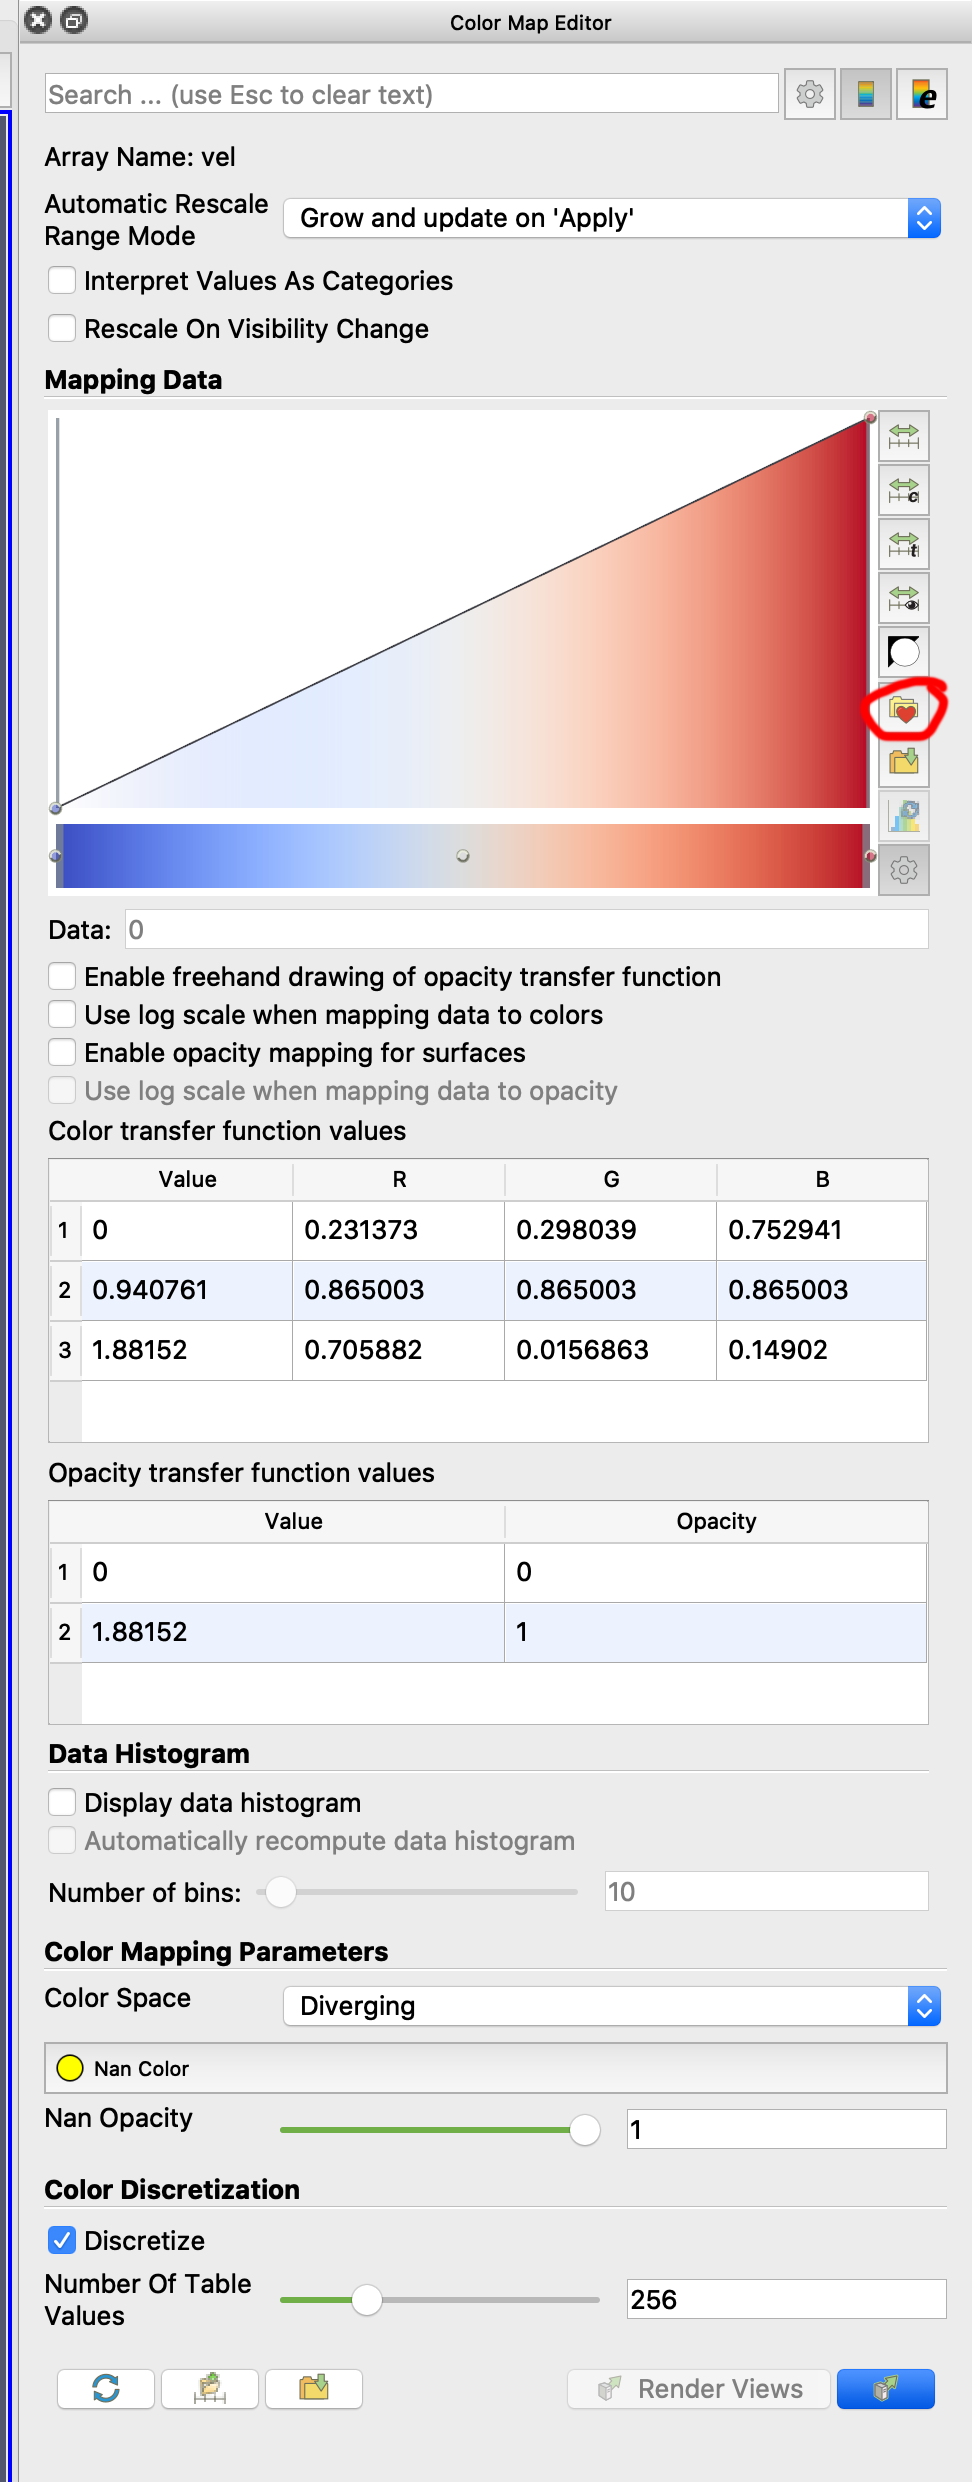
In the Color Map Editor window there’s a folder with a red heart on the right hand side of the color map preview
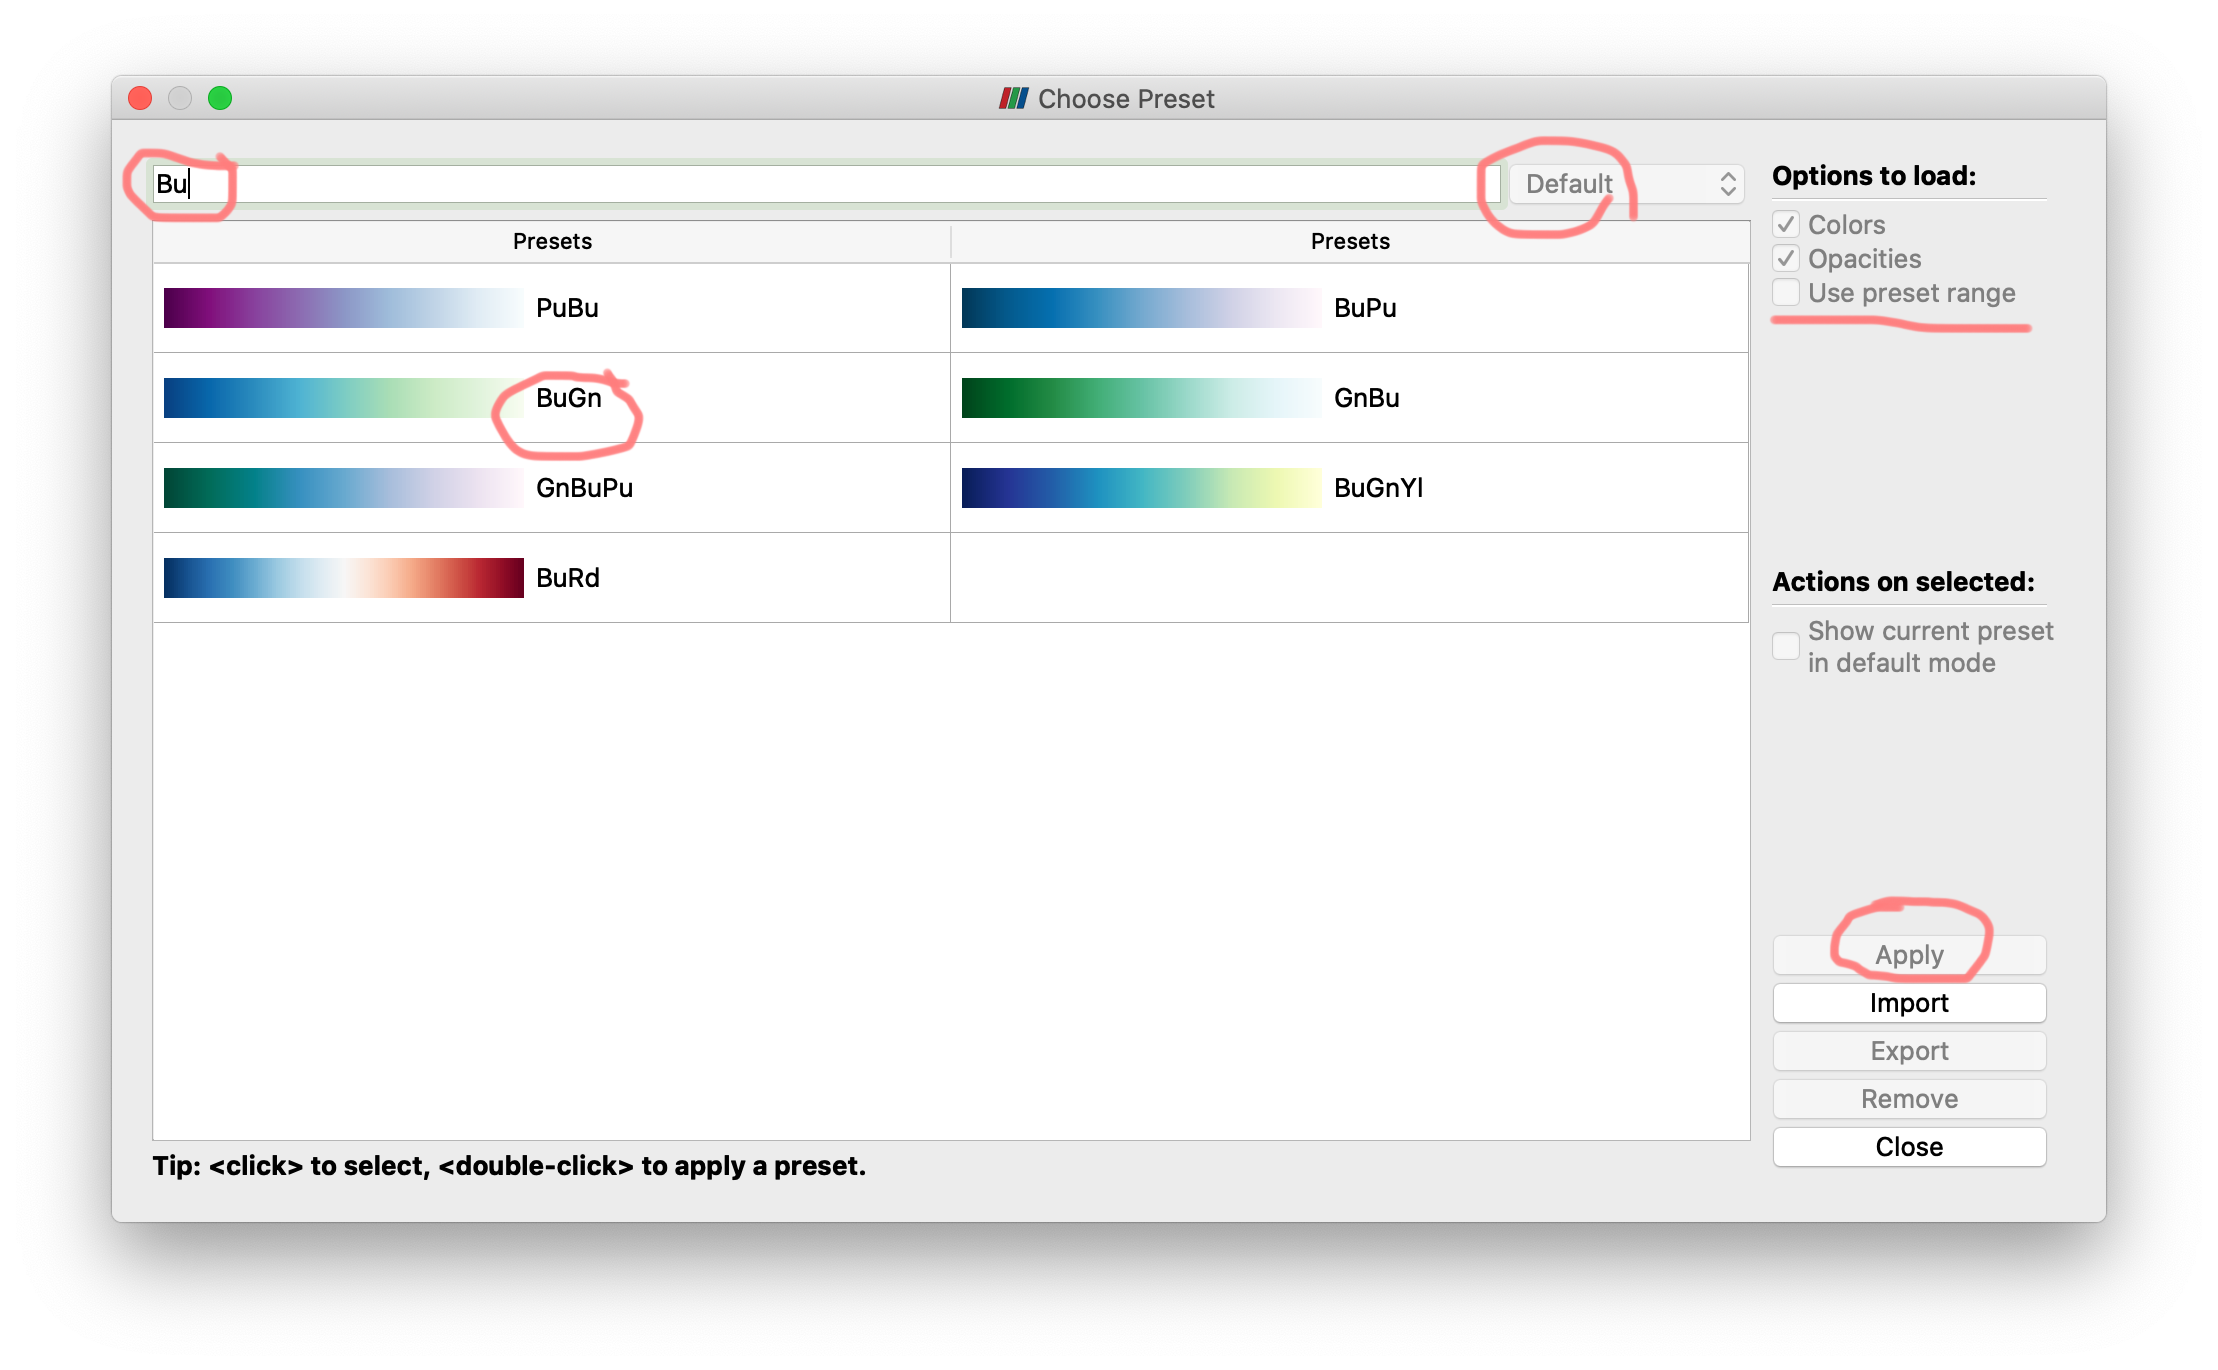
In the color map chooser window, you can select a color map from a wide range of options. By default, only a few of them are displayed. With the dropdown menu on the right [Default] you can chose from a couple groups or display all of them.
In the text field in the top, you can start typing letters that should appear in the name of the color bar. For anything with Blue, best chose b, Python-Style names usually exist, so we just type Bu.
You can chose to import a color map with its preset range (top right) - this can be useful if you e.g. customize a color map for display of annual mean temperatures and save it with that preset range for later use.
This should get you something like this:
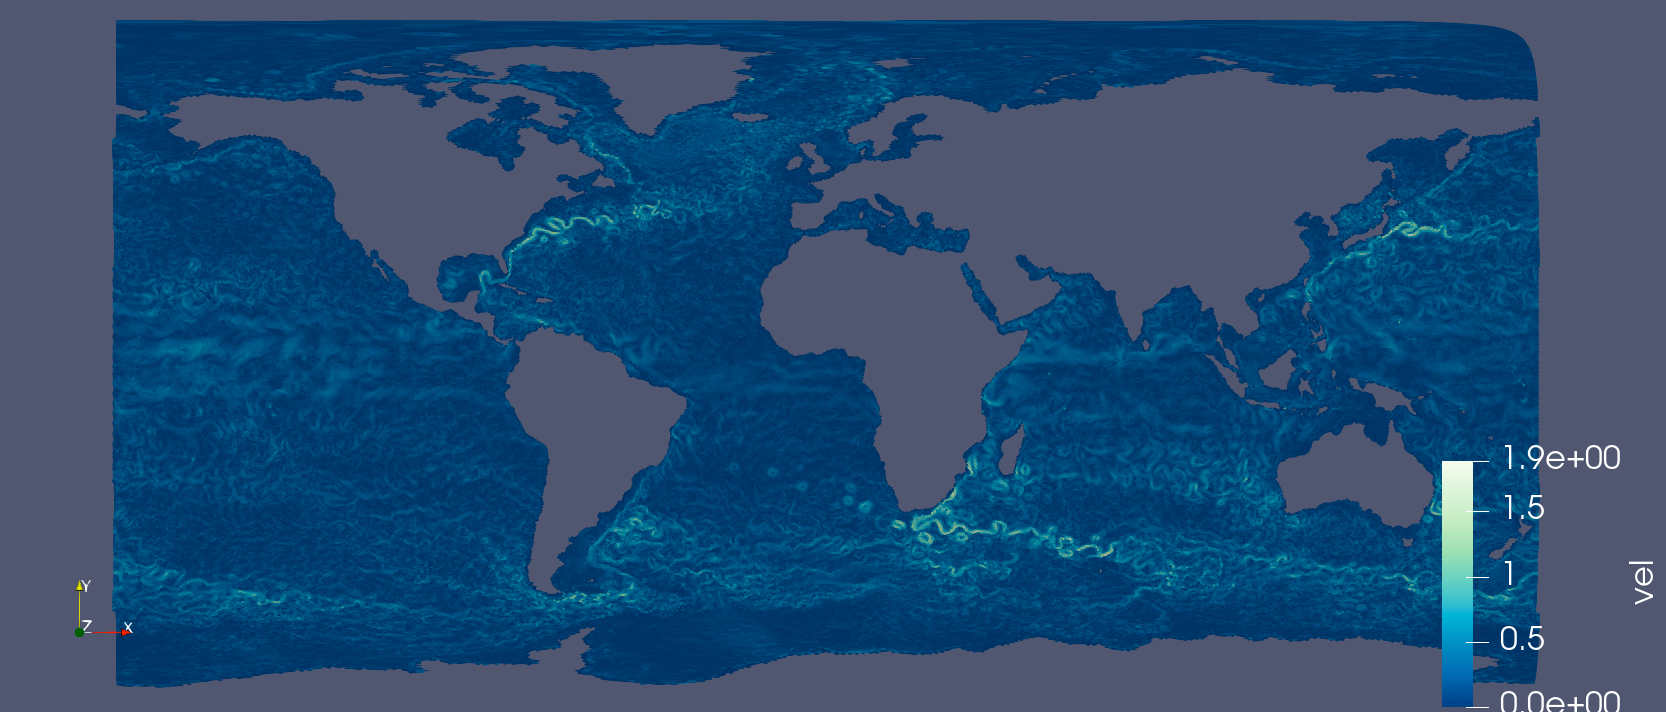
You can now Rescale the colormap to a custom range.
To brighten the colors you can Deactivate the light kit.